


When adding custom code such as PHP or JavaScript, there are times when you may need to find any possible errors in your code.
When enabled, WordPress debug will log any errors detected on your site. This can be key to finding the source of an issue or just learning more details about any possible errors on your site.
Enabling debug in WordPress
To enable debugging on your site, please follow the steps below.
1) Locating the wp-config.php file
By default, WordPress debug will be disabled. To enable it, you’ll need to access your site files through either FTP or cPanel.
2) Editing the wp-config.php file
Once your site files are open, you’ll need to open wp-config.php for editing. This will be located in the root folder of your site.
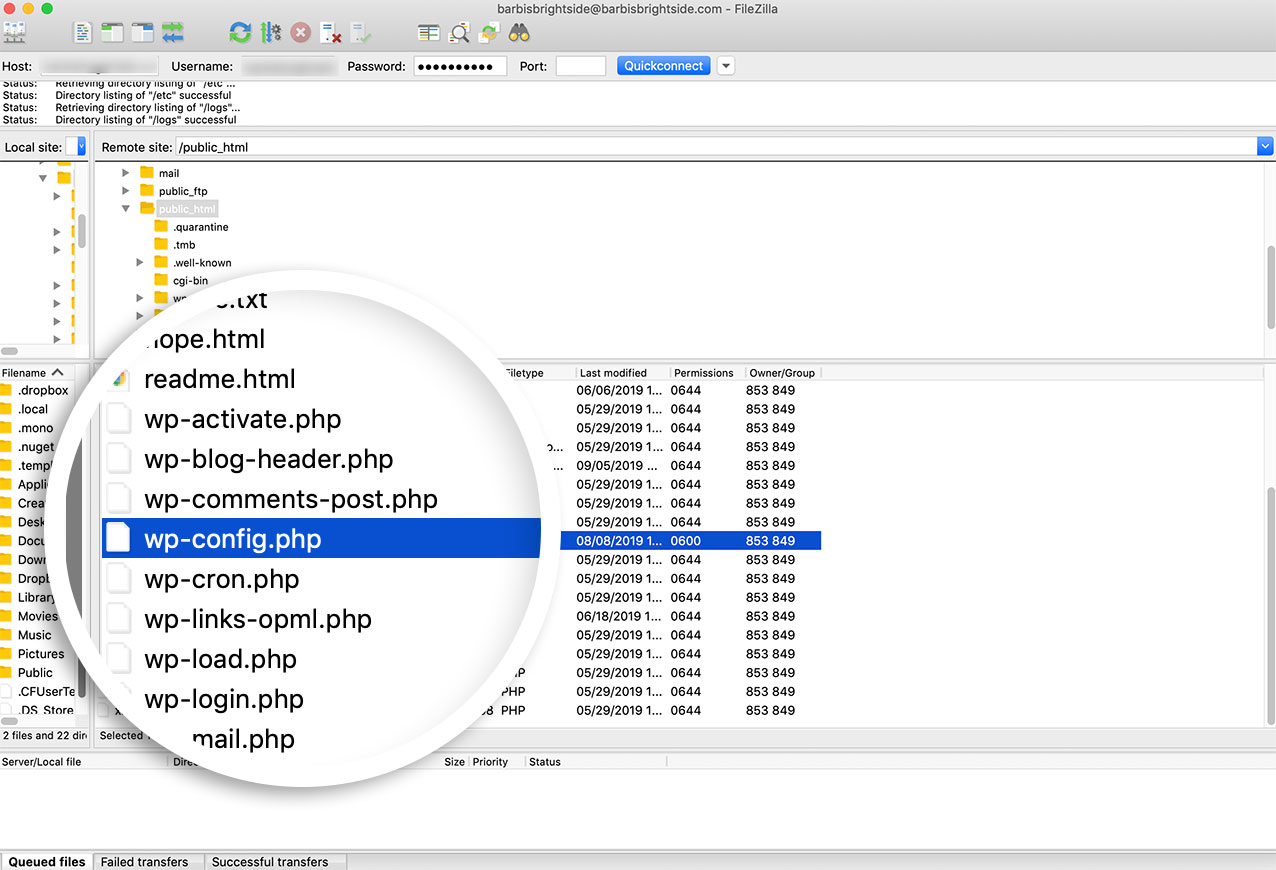
The wp-config file contains site-specific configuration settings, such as database information and, potentially, settings added by your hosting provider. For debugging, you’ll need to find this line of code (will generally be near bottom of file):
3) Adding your debug code
Copy and paste this code snippet over the line of code mentioned in Step 2.
// Enable WP_DEBUG mode
define( 'WP_DEBUG', true );

// Enable Debug logging to the /wp-content/debug.log file
define( 'WP_DEBUG_LOG', true );

// Disable display of errors and warnings
define( 'WP_DEBUG_DISPLAY', false );
@ini_set( 'display_errors', 0 );

// Use dev versions of core JS and CSS files (only needed if you are modifying these core files)
define( 'SCRIPT_DEBUG', true );
This code will need to be to inserted before the comment /* That’s all, stop editing! Happy blogging. */ in the wp-config,php file.
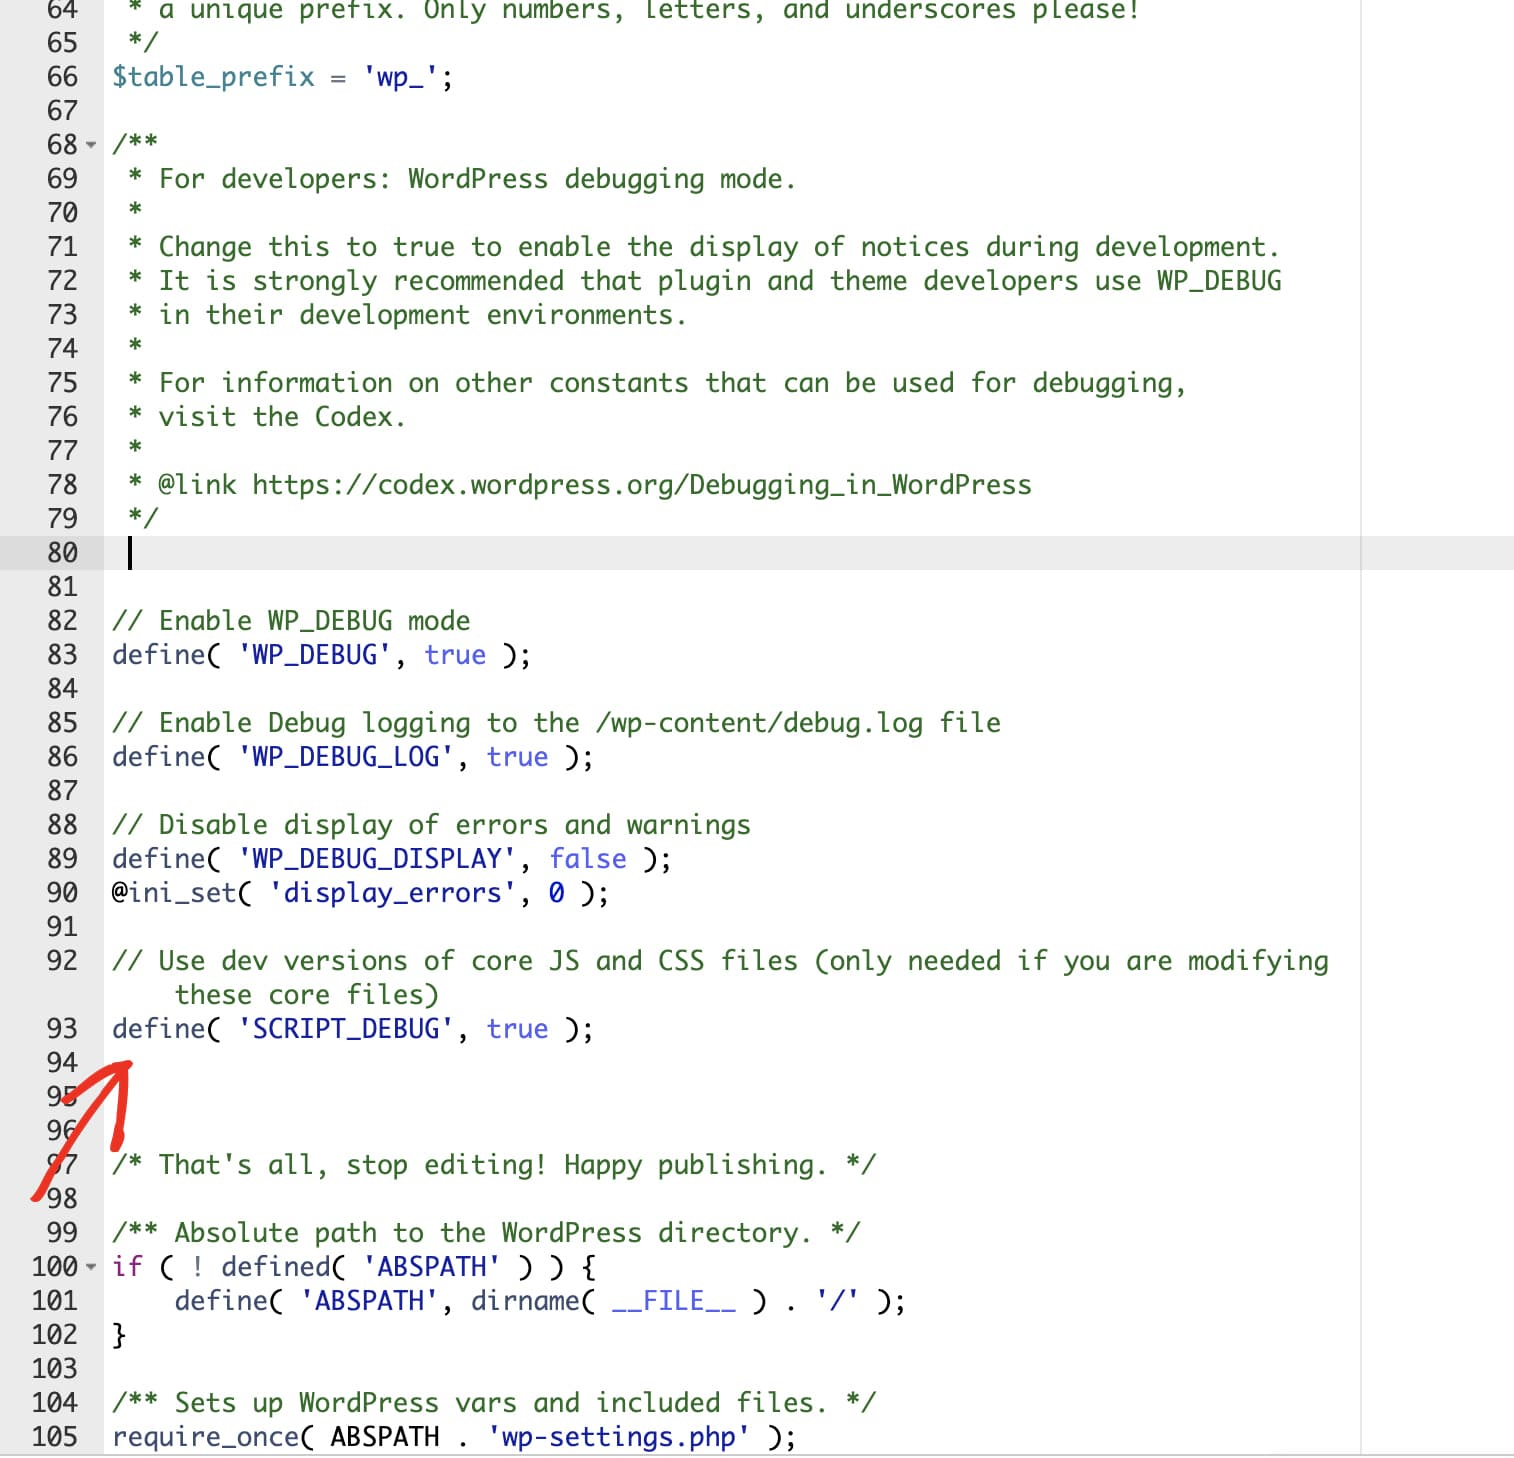
This will enable debugging and, importantly, prevent any logged data from displaying on your site. Instead, a debug log will be saved to your site files.
4) Replicating the issue
After saving these changes to wp-config.php, you’ll need to return to your site and replicate the issue you saw earlier. This will ensure that it gets recorded in the new error log.
5) Viewing the debug log
Then, you can return to your site files and open /wp-content/debug.log.
The contents of an error log can vary a lot depending on the cause and number of issues, but now you should be able to see extra details, such as a file path to the source of a code error, to help you better track down the issue.
('WP_DEBUG',false);Accessing the website at this point, would show you errors / debug output so that you can diagnose the problem with your site.